Amazon Seller P&L: Stop Overstating Margins by 20–40%

Amazon Seller P&L: Stop Overstating Margins by 20–40%
A true Amazon seller P&L equals net revenue minus landed COGS, minus Amazon fees, minus advertising, minus operating expenses. Net revenue starts as gross sales minus refunds, never gross sales alone. Amazon does not build this statement for you. Seller Central hands you raw transaction data, and you have to assemble the rest yourself, whether by spreadsheet or with automation like Resell-ready.
TL;DR:
- Fully landed COGS, including freight, duties, and prep, can be 20 to 40 percent higher than invoice price, significantly impacting profit margins.
- Separately tracking Amazon fees and COGS is essential to identify sourcing issues versus marketplace profitability, especially for account-level fees like storage or returns.
- Manual P&L reconciliation becomes error-prone beyond 20 to 30 SKUs, making automation tools valuable for real-time updates, fee matching, and batch cost application.
- Using an accrual-based method rather than cash-basis accounting prevents overestimating margins, especially when factoring in inventory costs, reimbursements, and long-term storage fees.
- Inventory unsold units should remain on the balance sheet as assets, with COGS only reflecting units sold, to avoid monthly profit distortions from premature expense recognition.
Looking for a tool to run the numbers? ResellReady's reseller profit calculator pulls live comps across eBay, Depop, Mercari, and Poshmark and calculates true net profit after fees. Compare plans and pricing — Basic starts with a 3-day free trial.
Table of Contents
- What Goes Into an Amazon Seller P&L Statement?
- How Do You Calculate Fully Landed COGS Per Unit?
- Which Seller Central Reports Map to Each P&L Line?
- Why Does Your P&L Overstate Profit (And How Do You Fix It)?
- How Do You Build a Monthly and Per-SKU P&L?
- Should You Automate Your P&L or Stick With Spreadsheets?
- What’s the Difference Between Gross Profit, EBITDA, and Net Profit?
- How Do Depreciation and Amortization Apply to Seller Assets?
- How Should Sales Tax and VAT Appear in Your Seller P&L?
- Why Doesn’t Your Bank Balance Match Your P&L Profit?
- How Do Unsold Inventory and Stock Changes Affect Your P&L?
- What Templates and Tools Do Amazon Sellers Actually Use?
- An Auditor’s Priorities for Your P&L
- Ready to See Your Real Margins Without the Spreadsheet Work?
- Sources
What Goes Into an Amazon Seller P&L Statement?
A P&L breaks your business into separate blocks, and keeping them separate is the whole point. Blend them together and you lose the ability to tell whether a sourcing problem or an operations problem is eating your margin.
Here’s what belongs in each block:
- Gross revenue: total product sales before any deductions, pulled straight from your Seller Central sales reports.
- Refunds: returned units and refunded orders, subtracted from gross revenue to get net revenue, your real top line.
- Cost of goods sold (COGS): the fully landed cost of the units you actually sold, not just what the invoice said.
- Amazon fees: referral fees, FBA fulfillment fees, storage fees, removal fees, and refund administration fees.
- Advertising: Sponsored Products, Sponsored Brands, and any other ad spend tied to moving units.
- Operating expenses: software subscriptions, prep center charges, virtual assistant wages, and other costs that keep the business running but aren’t tied to a single unit.
Amazon fees stay separate from COGS because they answer different questions. COGS tells you whether your sourcing deal is good. Amazon fees tell you whether the marketplace itself is still profitable for that SKU at current pricing. Mix them and you can’t tell if you need a new supplier or a price increase.
Sellers frequently miss account-level fees that don’t attach to any single order: long-term storage surcharges, inventory placement fees, and returns processing fees buried in monthly summaries. Review your P&L at least monthly. High-volume operations often move to weekly or even daily monitoring once ad spend swings enough to change unit economics mid-month.
How Do You Calculate Fully Landed COGS Per Unit?
Landed cost is where most seller P&Ls quietly lie. Using the supplier invoice price as your entire COGS is the single most common mistake sellers make, and it can make a real product mistaken for profitable when it’s actually break-even or worse.
Here’s the calculation, step by step:
- Start with the supplier unit price for the batch you’re costing.
- Add inbound freight for that batch, divided by the number of units it contained.
- Add duties and customs fees, again divided per unit.
- Add prep costs (labeling, poly bagging, bundling) per unit.
- Add any inspection or quality control fees per unit.
- Sum all five to get your true landed cost per unit for that specific batch.
Say a batch of units costs a total amount including supplier price, freight, duties, and prep, resulting in a landed cost per unit that is materially higher than the invoice price sellers often mistake for their real cost.
Batch costing matters because supplier prices shift. If you reorder at a different price, you need to tie each sale to the batch it came from, or use a weighted average across open batches, so your margin numbers reflect reality rather than whichever invoice you looked at last. Full guidance on this lives in Resell-ready’s landed cost calculation guide.
Pro Tip: Track COGS by purchase batch and never overwrite historical cost data when you reorder. Overwriting past batch costs retroactively distorts every prior month’s margin, which makes trend analysis useless.
Which Seller Central Reports Map to Each P&L Line?
Building your P&L means pulling the right exports and knowing exactly where each number lands. Seller Central gives you the raw data, not the finished statement.
- Payments reports and date range reports feed gross sales and refunds, giving you the raw figures behind net revenue.
- Transaction reports break out individual order-level fees, useful for reconciling referral fees against expected rates.
- Fee preview and FBA fee reports populate your Amazon fees block: fulfillment, storage, and removal charges all show up here, tied to Amazon’s Fulfillment by Amazon program structure.
- Advertising console exports give you campaign-level spend, which you divide by units sold to get a per-unit ad cost.
- Reimbursement reports capture Amazon’s repayments for lost or damaged inventory, which need to be netted against losses, not counted as pure upside.
Reconcile all five monthly. One-off reimbursements and chargebacks in particular tend to land in a different month than the loss they’re correcting, so isolate them rather than letting them smear across your regular margin trend.
Why Does Your P&L Overstate Profit (And How Do You Fix It)?
Most inflated P&Ls share one root cause: they’re built on a cash-basis mindset when a management P&L needs to be accrual-based. Cash-basis accounting counts money as it moves, which flatters you the month you get a big reimbursement and crushes you the month a huge inventory bill hits. Accrual accounting ties costs to the sale that generated them, which is what you actually need to judge SKU performance.
Two specific errors do the most damage:
- Using invoice cost instead of landed cost overstates gross margin on nearly every SKU, sometimes by 20 to 40 percent once freight and duties get factored in properly.
- Ignoring storage fees and return costs hides the slow bleed of aged inventory sitting in a fulfillment center for months, a problem inventory mismanagement compounds the longer stock sits unsold.
Fix it with a standing routine: apply true landed COGS to every batch, allocate account-level fees across the SKUs that generated them, reconcile reimbursements separately from regular sales, and run a monthly audit checklist before you trust any margin number.
How Do You Build a Monthly and Per-SKU P&L?
A usable P&L template needs both an account-level summary and a per-SKU breakdown, because a healthy overall number can hide two or three SKUs quietly losing money.
At minimum, your template needs these columns per SKU: units sold, net revenue, landed COGS, Amazon fees, ad spend, allocated operating expenses, and contribution margin (net revenue minus everything else). Roll those up into an account-level summary that adds fixed operating costs like software and labor to reach true net profit.
The monthly routine looks like this:
- Export sales, fee, and advertising reports from Seller Central and your ad console.
- Apply landed batch COGS to every unit sold that month.
- Allocate storage fees, tool subscriptions, and prep costs across the SKUs that incurred them.
- Reconcile reimbursements and refunds against the orders they correspond to.
- Calculate per-SKU contribution margin and roll up to account-level net profit.
Once you have contribution margins, bucket every SKU into one of four groups:
- Stars: high margin, strong velocity. Reorder and consider expanding.
- Solid: acceptable margin, steady sales. Leave alone, monitor for fee creep.
- Marginal: thin or shrinking margin. Investigate pricing, ad spend, or a cheaper supplier before the next reorder.
- Losers: negative contribution margin. Cut ad spend immediately and plan an exit, whether that’s a price increase or liquidation.
This bucketing approach reflects a pattern seen across seller accounts: a small share of SKUs typically drives most of the profit, while a long tail barely breaks even or loses money outright. Resell-ready’s product profitability guide walks through a fuller version of this bucketing process if you want to go deeper on any one category.
Should You Automate Your P&L or Stick With Spreadsheets?
Spreadsheets work fine when you’re running a handful of SKUs and updating your numbers once a month. The math is simple enough to track by hand, and a well-built template gets you most of the way there.
Automation earns its cost once you’re managing dozens of SKUs, multiple batches with different landed costs, or ad campaigns that shift daily. At that scale, manually reconciling reimbursements and re-allocating storage fees every month becomes a job in itself, and errors creep in faster than you can catch them.
What automation typically saves you:
- Live per-SKU P&L that updates as sales and fees post, rather than waiting for month-end.
- Automatic fee reconciliation against Amazon’s own transaction records.
- Reimbursement detection, catching Amazon repayments you’d otherwise have to hunt for manually.
- Batch COGS applied automatically to the right units, no manual weighted-average math.
- Time-series trend tracking, so a margin drop shows up the week it happens, not the month after.
Some software platforms build toward exactly this workflow: paste an ASIN for instant profitability insight, track capital across an automated inventory dashboard, and watch net profit and ROI update in real time as sales post. A seller running 60 SKUs across three suppliers can lose a full afternoon a month to manual reconciliation. Automating that reconciliation is the kind of time recovery that compounds every month it runs.
What’s the Difference Between Gross Profit, EBITDA, and Net Profit?
Gross profit only tells you the story up to Amazon fees and COGS. It’s net revenue minus landed COGS, nothing else deducted yet. A lot of sellers stop here and think they know their margin. They don’t.
EBITDA (earnings before interest, taxes, depreciation, and amortization) strips out financing and accounting decisions to show how the core operation performs. For most Amazon sellers, EBITDA lands close to net revenue minus COGS, Amazon fees, advertising, and operating expenses, before you factor in loan interest or asset depreciation. It’s a useful number when you’re comparing performance year over year, or when you’re preparing to sell the business, because buyers evaluate seller accounts on EBITDA multiples far more often than raw net profit.
Net profit is the real bottom line: EBITDA minus interest on any financing, minus taxes owed, minus depreciation and amortization. This is the number that tells you what actually landed in the bank after every obligation gets paid.
The gap between gross profit and net profit is often larger than sellers expect. A SKU that looks like it clears 35 percent gross margin can shrink to single digits once advertising, storage, software subscriptions, and financing costs get layered in. If you’re only tracking gross profit, you’re tracking half the picture, and the half that flatters you the most.
How Do Depreciation and Amortization Apply to Seller Assets?
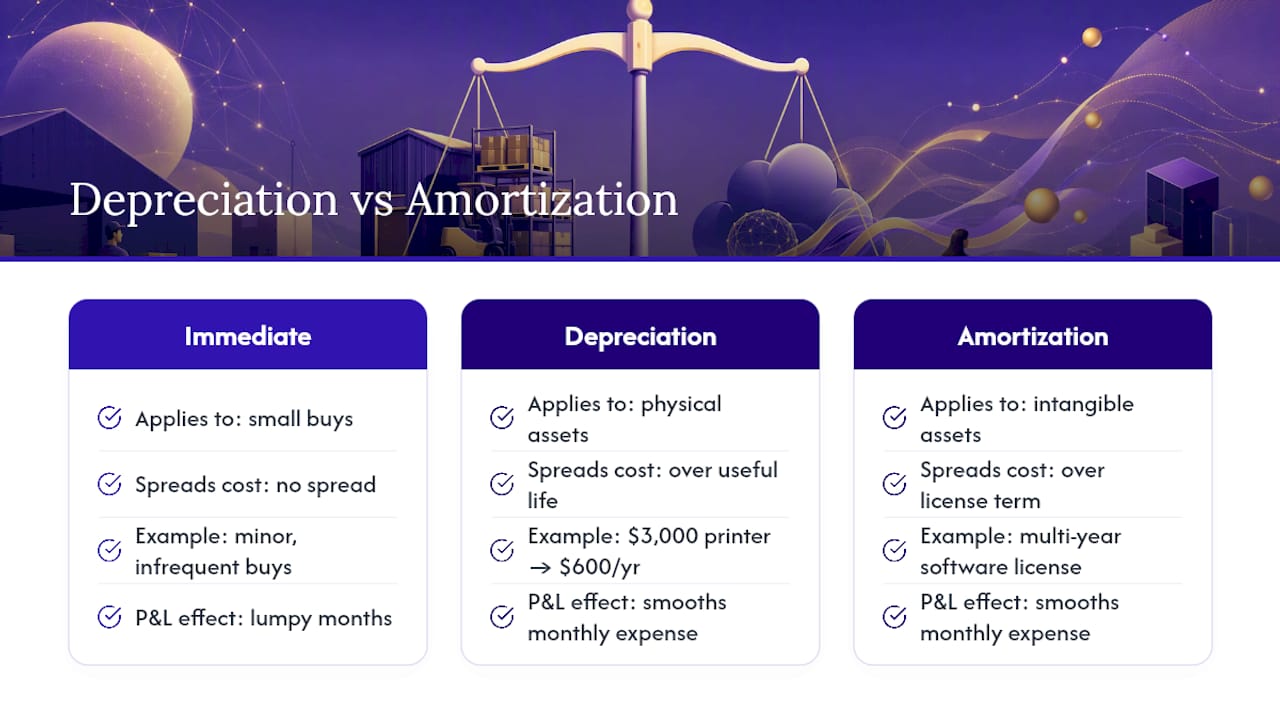
Most Amazon sellers don’t own much that depreciates, but the ones who do often miscategorize it. Equipment like barcode scanners, prep station tools, warehouse shelving, or a company vehicle used for sourcing runs all qualify as depreciable assets rather than one-time operating expenses.
Depreciation spreads the cost of a physical asset over its useful life instead of expensing it all in the month you bought it. A $3,000 label printer with a five-year useful life gets expensed at roughly $600 a year, not $3,000 in month one. This matters for your P&L because expensing the full amount immediately makes that month look far worse than it actually was, and every following month look artificially better.
Amortization works the same way for intangible assets: software licenses purchased outright, trademark registration costs, or a purchased supplier list. If you bought a piece of software with a multi-year license instead of a monthly subscription, amortizing that cost across its license term keeps your monthly P&L consistent rather than lumpy.
Most small sellers can skip formal depreciation schedules if their asset purchases are minor and infrequent. Once you’re investing meaningfully in warehouse equipment, vehicles, or long-term software licenses, talk to an accountant about setting up a proper depreciation schedule. It changes your tax liability and gives a cleaner month-to-month view of operating performance.
How Should Sales Tax and VAT Appear in Your Seller P&L?
Sales tax and VAT are not revenue, and they should never sit in your gross revenue line even though Amazon often collects them as part of the customer-facing price. Amazon typically collects and remits sales tax on your behalf through its marketplace facilitator programs, but that collected tax should flow straight through your books rather than getting counted as sales you keep.
For sellers with international exposure, VAT works similarly but carries more manual burden. If you’re registered for VAT in a market you sell into, the VAT you collect is a liability owed to that country’s tax authority, not income. Keep it in a separate liability line, not folded into revenue or expenses, so your net profit figure reflects money you actually keep rather than money passing through your hands on its way to a government.
The practical fix is simple: reconcile your marketplace tax reports separately from your P&L revenue lines. Most sellers track this as a below-the-line item, noted for compliance purposes but excluded from the profit calculation entirely. Getting this wrong doesn’t just distort your margin analysis. It can create real compliance exposure if collected tax gets treated as spendable income and isn’t set aside for remittance. Talk to a qualified tax professional about your specific state and international obligations, since thresholds and rules vary by jurisdiction and change often.
Why Doesn’t Your Bank Balance Match Your P&L Profit?
Profit and cash are two different animals, and confusing them causes more small-business failures than any single accounting error. Your P&L can show a healthy profit for the month while your bank account tells a completely different story.
The mismatch usually comes from timing. Amazon pays out on a roughly biweekly cycle, which means sales from late in one month often land in your bank account in the following month. Meanwhile, inventory purchases hit your cash the moment you pay the supplier, often weeks or months before those units sell and generate revenue on your P&L. A seller who just placed a large reorder can show strong paper profit while sitting on a thin bank balance, simply because the cash already left for inventory that hasn’t sold yet.
Reconciling the two means building a simple cash flow view alongside your P&L: opening cash balance, plus Amazon payouts received, minus inventory purchases, minus operating expenses paid, minus any loan payments, equals closing cash balance. Run both side by side monthly. If profit is consistently strong but cash is consistently tight, that’s usually a sign you’re reinvesting faster than your payout cycle can support, not that your business is failing.

How Do Unsold Inventory and Stock Changes Affect Your P&L?
Unsold inventory sitting in a warehouse isn’t an expense yet, and treating it like one is a common P&L distortion. When you buy 1,000 units but only sell 600 in a given month, your COGS for that month should reflect the landed cost of those 600 units sold, not the full purchase cost of all 1,000.
The remaining 400 units stay on your books as inventory, an asset, not an expense. They become a COGS expense only in the month they actually sell. This is why a big inventory purchase can look like it tanked your monthly profit if you expense it all at once. It didn’t tank your profit. It tanked your cash, which is a different problem tracked on a different statement.
At month-end, reconcile your inventory count against what your books say you should have. Shrinkage, damage claims, and warehouse errors all show up as discrepancies between physical stock and book stock, and those differences need to get written off as a loss rather than silently ignored. A seller carrying $40,000 in unsold inventory that never gets reconciled against actual warehouse counts is one inventory audit away from an unpleasant surprise.
Track unsold stock value separately from your profit calculation, and only pull it into COGS as units actually sell. It keeps your monthly P&L honest about what happened that month, rather than punishing you for a purchase decision made weeks earlier.
What Templates and Tools Do Amazon Sellers Actually Use?
Most sellers start with a spreadsheet template, and that’s a reasonable place to begin. A solid template needs, at minimum, monthly tabs for gross revenue, refunds, landed COGS by batch, Amazon fees broken into referral and fulfillment and storage, advertising spend, operating expenses, and a per-SKU contribution margin sheet. Google Sheets and Excel both handle this fine for sellers under roughly 20 to 30 active SKUs.
Past that scale, the manual reconciliation burden usually outpaces the value of staying spreadsheet-native. That’s the point where dedicated software, like Resell-ready’s automated P&L and inventory tracking, or general small-business accounting platforms, starts paying for itself in hours saved rather than features gained.
Whichever route you choose, the template structure matters more than the tool. A spreadsheet with proper batch-level COGS beats a fancy dashboard fed by invoice-price shortcuts every time. Get the inputs right first. Resell-ready’s broader blog covers additional operational breakdowns if you’re building your own template from scratch and want more worked examples.
An Auditor’s Priorities for Your P&L
When auditing a seller’s P&L, three things get checked first: whether COGS reflects landed cost or invoice cost, whether storage and reimbursement fees are allocated at all, and whether the numbers are accrual based rather than a snapshot of whatever hit the bank that week.
For margin compression specifically, the checklist is short: pull the last three months of ad spend per SKU, check for storage fee creep on slow movers, and confirm no batch is still costed at an old, cheaper supplier price.
— Christian
Ready to See Your Real Margins Without the Spreadsheet Work?
If you’ve made it this far, you already know the manual version of this process works but eats hours every month: exporting reports, applying batch COGS by hand, chasing reimbursements, re-checking storage fee allocations. Resell-ready exists to remove that grind. It gives you live per-SKU profit tracking, automatic batch COGS application, and reimbursement monitoring, so the P&L updates as your sales post instead of waiting for a month-end scramble.

For sellers focused on footwear resale specifically, the sneaker reselling ROI tracker shows exactly how ROI and net profit calculations run in practice. If you’re sourcing in bulk, the pallet liquidation ROI estimator handles the landed cost math on mixed-lot inventory automatically. Start a free trial, paste in a few ASINs, and see your real per-SKU margins before your next reorder decision.
Sources
- The Amazon Seller P&L: How to build one that tells the truth (sellerboard blog)
- Seller Central (official)
- Sell
- How to Read an Amazon Profit and Loss Statement | Jarvio Blog
Recommended
Ready to flip smarter?
ResellReady shows real sold prices, surfaces profitable deals, and builds your buying plan — the Basic plan starts with a 3-day free trial.
Get Started →