10% Net Margin Rule: Buy or Pass Framework for FBA Resellers

10% Net Margin Rule: Buy or Pass Framework for FBA Resellers
Buy if the ASIN or lot scores at or above your threshold on a weighted scorecard and nets at least 10% margin after every fee, with 15%+ ROI on landed cost. Test small if it clears margin but misses on velocity or competition. Pass if it fails either. The quick move: run a fast pre-filter on price history and fees before you touch a full calculation.
TL;DR:
- A scorecard prioritizes net margin, sales velocity, competition, and return risk, with 30% to 20% weightings, guiding decisions with a 75-point threshold for buying.
- Before purchase, verify 12 months of stable price history, complete landed cost, platform fees, estimated ad spend, seasonality, and supplier credentials to avoid dead inventory.
- Net margin calculation incorporates all costs, including fees and advertising, with a typical viable margin above 10% and a target ROI of 15 to 20 percent.
- Operational factors like supplier lead time, storage seasonality, and return rates can turn a buy into a pass, requiring conservative estimates and strict thresholds.
- Automating the framework with tools like Resell Ready streamlines bulk evaluations, real-time profit tracking, and alerts at margin thresholds, enabling sourcing at scale.
Looking for a tool to run the numbers? ResellReady's reseller profit calculator pulls live comps across eBay, Depop, Mercari, and Poshmark and calculates true net profit after fees. Compare plans and pricing — Basic starts with a 3-day free trial.
Table of Contents
- What Is a Buy or Pass Framework for FBA Sourcing?
- What Data Should You Collect Before Buying an ASIN?
- How Do You Calculate Net Margin and ROI on an ASIN?
- What Margin and ROI Thresholds Should You Actually Use?
- Which Operational Factors Can Flip a Buy Into a Pass?
- How Does Resell Ready Automate the Buy or Pass Framework?
- A Practitioner’s Take on Why the Math Gets Skipped
- Try the Framework at Scale With Resell Ready
- Sources
- FAQ
What Is a Buy or Pass Framework for FBA Sourcing?
A buy or pass framework is a scoring system that turns sourcing decisions into a repeatable process instead of a gut call. Most resellers who blow up their capital do it the same way: they get excited about a lot, skip the math, and find out three weeks later that the “great deal” nets 4% after Amazon’s fee stack eats it alive. A working investment decision framework fixes that by scoring every candidate on the same criteria before money leaves your account.
The scorecard runs on five or six weighted dimensions, and the weightings matter more than the individual scores. A common split looks like this:
- Net margin (30%) — the single biggest predictor of whether a SKU is worth touching
- Sales velocity (20%) — how fast the lot or ASIN actually turns
- Competition density (20%) — number of sellers on the listing and Buy Box volatility
- Return rate risk (15%) — category-driven, and often underestimated
- Sourcing reliability (10%) — supplier track record, sample consistency, communication
- Lead time and carrying cost (5%) — how long cash is tied up before it comes back
Run this as a two-stage workflow. Stage one is a rapid pre-filter: pull price history, estimated fees, and rough competition count on a batch of ASINs in minutes, and eliminate the obvious losers. Stage two is the full evaluation, reserved for whatever survives the filter. A composite score above 75 out of 100 usually means buy. Between 55 and 75 means test with a small order. Below 55 means pass, no matter how good the deal sounds on the surface.
What Data Should You Collect Before Buying an ASIN?
Before you commit capital, work through this checklist in order. Skipping steps is how experienced sellers still end up holding dead inventory.
- Pull 12 months of price history and Buy Box share. A single-week price spike is not a trend. Look for stability, not a lucky snapshot.
- Build the complete landed cost. Supplier unit price, sample cost amortized across the order, duties, inbound freight, and prep center charges all belong in this number, not just the invoice price.
- Add platform fees line by line. Referral fee, per-unit FBA fulfillment fee, the inbound placement fee, and a monthly storage allocation per unit.
- Estimate ad spend per unit using a TACoS method. If you cannot rank without ads, that spend is a real cost, not a rounding error.
- Project velocity and seasonality. A toy that only sells in November is a different investment than a supplement that sells year round.
- Estimate a realistic return rate. Model it conservatively. Returns frequently run 2 to 3 times the naive percentage once you count unsellable units and lost ad spend.
- Verify the supplier. Check for business licensing, request references, and confirm they have shipped this exact product before, following the four-filter sourcing approach of checking competition, margin, demand, and feasibility together.
Watch for fail-fast red flags: a supplier who won’t provide samples, a listing with more than 15 active sellers fighting for the Buy Box, or a category with a return rate history above 10%. Any one of those should stop the evaluation cold.
Pro Tip: Run the price history check first, always. It takes thirty seconds and kills more bad deals than any other single step in the checklist.
How Do You Calculate Net Margin and ROI on an ASIN?
Gross margin lies to you. Net margin, calculated after every real cost hits the ledger, is the only number that should drive a purchase evaluation criteria decision. Here’s the stack, in order:
- Selling price
- Minus referral fee (category dependent, typically 8 to 17%)
- Minus FBA fulfillment fee (weight and size tiered)
- Minus inbound placement fee
- Minus prep center cost per unit
- Minus inbound shipping allocated per unit
- Minus storage allocation per unit
- Minus advertising allocation per unit
- Minus expected return cost
Take a $25 product with a $9 landed cost. Referral fee runs $3.75. FBA fulfillment lands at $4.20. Inbound placement adds $0.35. Prep and inbound freight together run $1.10. Storage allocation comes to $0.30, and ad spend eats another $1.50. Total costs: $9 landed plus $11.20 in fees and operating costs, for $20.20 against $25 revenue.
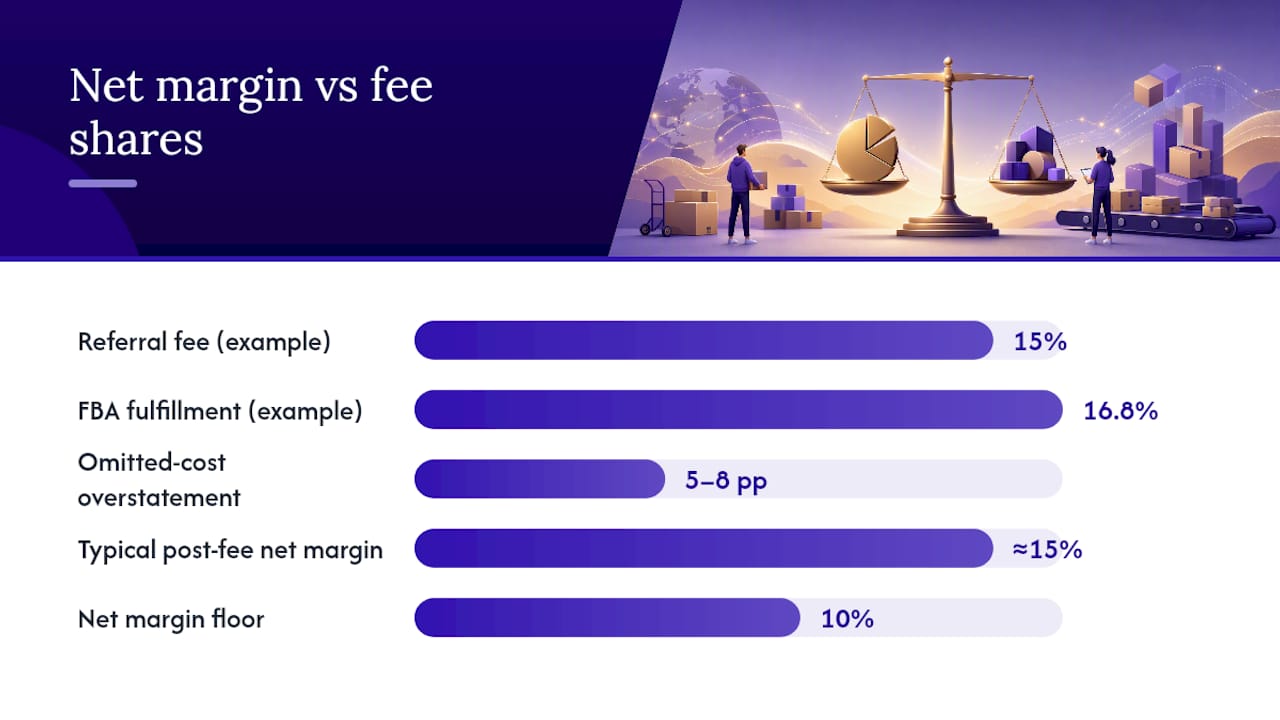
That result sits comfortably above the 10% net margin floor that separates a viable wholesale product from a losing one, and it beats the roughly 15% net margin a typical $100 revenue waterfall produces after the full fee stack. The most common mistake here is stopping the math after subtracting referral and fulfillment fees and calling that the margin. Forgetting placement fees and ad allocation alone can overstate margin by 5 to 8 percentage points, which is the gap between a buy and a pass.
What Margin and ROI Thresholds Should You Actually Use?
Numbers only work as a financial decision-making model if you enforce them without exceptions. These are the floors worth holding to:
- ROI target: 15 to 20% on landed cost, meaning every $1,000 invested should return roughly $150 to $200 in profit once the inventory clears.
- ASP floor: apply the 3× rule. Selling price should run roughly three times landed cost, and anything selling under $12 to $15 rarely survives the fee stack intact.
- Reorder rule: start with a conservative test order, then scale only after the first batch confirms velocity and return rate assumptions hold.
- Portfolio rule: cap any single SKU or supplier at a fixed share of total inventory capital, so one bad lot can’t sink the quarter.
Which Operational Factors Can Flip a Buy Into a Pass?
The scorecard math assumes clean conditions. Real sourcing rarely delivers them, and the gap is where deals quietly go bad.
Supplier lead time changes your cash conversion cycle more than most sellers admit. A 45-day lead time doubles the capital you have tied up compared to a 20 day supplier, even when every other number on the scorecard is identical.
Prep center workflows carry per-unit and per-shipment charges that vary by complexity: poly bagging, labeling, bundling, and fragile-item handling all add line items that a quick mental estimate tends to miss. Storage seasonality matters just as much. A lot that looks fine in March can trigger long-term storage fees if it’s still sitting in a fulfillment center in October.

Returns need the same conservative treatment across every category you evaluate, not just the ones with obvious complexity, since undercounting them is one of the most common ways a “good” ASIN quietly turns into a loss.
How Does Resell Ready Automate the Buy or Pass Framework?
Running this scorecard by hand on ten ASINs is manageable. Running it on two hundred, weekly, across multiple suppliers, is a spreadsheet nightmare that quietly breaks down the moment someone forgets to update a formula. That’s the gap Resell Ready is built to close.
- Paste a batch of ASINs and get real-time ROI and net profit estimates without building a fee stack from scratch each time.
- Cross-reference candidates against a verified supplier database before committing capital to an unfamiliar vendor.
- Run bulk pre-filters first, then drill into full per-unit calculations only for the SKUs that clear your threshold, mirroring the two-stage workflow that keeps sourcing at scale manageable.
- Set watchlist alerts on price targets and let automated P&L tracking flag SKUs falling below your margin floor before they drain the following quarter’s budget.
Pro Tip: Set your watchlist alert at your actual margin floor, not your target margin. That way the alert fires with enough runway to act, instead of after the damage is already done.
A Practitioner’s Take on Why the Math Gets Skipped
The fastest filter I’d recommend is the price history check. Thirty seconds, and it kills more bad deals than the rest of the checklist combined. The costliest mistake is skipping the return rate estimate. A seller who ignores that number on a fragile-item category can watch a 15% margin evaporate into a loss within one reorder cycle. The framework only works if you run every step, every time.
— Christian
Try the Framework at Scale With Resell Ready
Running this scorecard on a handful of ASINs by hand is fine. Running it across a real sourcing pipeline, weekly, across multiple suppliers, is where Resell Ready earns its keep: it turns the pre-filter and full calculation stages into one workflow instead of two spreadsheets you have to keep in sync.
If you’re pulling pallets or wholesale lots, the Pallet Liquidation ROI Estimator applies this exact scorecard to bulk buys, factoring landed cost and category risk automatically. If sneakers are your category, the Sneaker Reselling ROI Tracker does the same for individual ASINs and resale platforms. Start with a trial run on your next shortlist of candidates and see where the composite score actually lands before you commit capital.
Sources
- Amazon FBA Fees & Real Wholesale Profit Margins | Jakub Filipcsik
- Amazon FBA Profit Margin: What’s Normal After Fees and Ads?
- Stop Guessing Which Products to Sell on Amazon FBA — A Data-Driven Sourcing Approach That Protects Your Budget
FAQ
What Score Should Trigger a Buy Decision?
Scores between 55 and 75 call for a small test order first.
How Do I Test a Product Before a Full Buy?
Order a conservative first batch, often in the 200 to 500 unit range depending on unit cost, and use it to confirm real velocity and return rates match your projections before scaling.
How Do I Fold Returns Into the Margin Calculation?
Model returns conservatively, at two to three times the naive percentage, since unsellable returned units and lost ad spend both add real cost beyond the simple refund amount.
Can Resell Ready Run This Framework Automatically?
A platform automates real-time ROI and net profit tracking, bulk ASIN pre-filtering, and watchlist alerts, letting you apply the same scorecard thresholds across an entire sourcing pipeline instead of one SKU at a time.
Recommended
Ready to flip smarter?
ResellReady shows real sold prices, surfaces profitable deals, and builds your buying plan — the Basic plan starts with a 3-day free trial.
Get Started →