2026 FBA Pricing Strategy: Protect Margin From $10 and $50 Fee Bands

2026 FBA Pricing Strategy: Protect Margin From $10 and $50 Fee Bands
Price to a per-unit dollar floor first, then place your anchor and target against sold comps, and always check the current FBA fee band before you touch the price box. Skip that order and repricers will happily march your price down until Amazon’s fee bands eat the margin you thought you had. Run the SKU through Fee Preview, compute the net-dollar floor, then check what your repricer’s band settings are actually doing.
TL;DR:
- Always calculate your SKU’s minimum profitable price using a detailed formula that includes COGS, fees, labor, advertising, and surcharges to avoid margin erosion.
- Crossings of the $10 and $50 price bands significantly increase fulfillment fees and surcharges, which can negate profit gains from price increases.
- Use sold rather than active listing prices to determine market value, and build a three-tier pricing ladder with anchor, target, and floor prices for strategic selling.
- Implement band-aware repricing rules with SKU-level floors and regularly update fee assumptions to prevent silent margin losses caused by static fee models.
- Monitor aged-inventory and automate SKU review cadences, especially around fee boundary SKUs and long-sitting stock, to avoid costly liquidation fees and optimize profit margins.
Looking for a tool to run the numbers? ResellReady's reseller profit calculator pulls live comps across eBay, Depop, Mercari, and Poshmark and calculates true net profit after fees. Compare plans and pricing — Basic starts with a 3-day free trial.
Table of Contents
- How to Calculate a True Per-SKU Floor Price
- Pricing Models That Work for FBA Sellers: Comping, Premium, and Reverse-Floor
- Safe Repricing Rules and Automation: How to Keep Repricers From Eating Your Margin
- 2026 FBA Fee Bands, Fuel Surcharge, and How Small Price Moves Cut Net Margin
- Launch Pricing and Promotional Cadence: A Week-by-Week Playbook
- Pricing Across the Lifecycle: Markdowns, Clearance, and Aged Inventory
- Operating These Pricing Rules at Scale
- Put This Pricing Playbook on Autopilot
- Primary Sources for the Fee Math
- Sources
How to Calculate a True Per-SKU Floor Price
Most sellers price from the outside in. They check three competitor listings, undercut by a dollar, and call it a strategy. That works fine until the SKU crosses a fee boundary or the 3.5% fuel surcharge quietly adds a few cents to every unit shipped. A floor price flips that logic: you build the number from your own costs upward, and comps only get consulted once the floor is locked.
The inputs your floor model needs, every time:
- Landed COGS — unit cost plus freight, duty, and any per-unit sourcing fee.
- Inbound placement fee — the per-unit charge Amazon assesses for routing inventory to its network, which varies by size tier and destination spread.
- Prep and labeling — poly-bagging, bundling, FNSKU labels, whatever your prep workflow bills per unit.
- Referral fee percentage — category-based, typically 8% to 17%, applied to the final sale price.
- Fulfillment fee per Amazon band — pulled from the SKU’s actual size tier and price band, not a rate card average.
- Fuel and logistics surcharge multiplier — apply 1.035 against the fulfillment fee line, not the whole order.
- Returns and repair drag — average return rate for the category times average refund/repair cost, spread across all units sold.
- Pick, pack, and labor overhead — anything your team touches by hand outside Amazon’s fulfillment, including quality checks.
- Advertising share per unit — your trailing ACOS converted to a dollar figure per sale, even if you plan to taper it later.
- Sales tax assumptions — most FBA sellers have this handled through Amazon’s tax collection, but confirm it isn’t silently reducing your net.
Once those ten lines are filled in, the floor formula is straightforward. You’re solving for the gross price that delivers your required net-dollar margin after fees and cost of goods come out:
Gross price = (Required net margin + Total fees + COGS) ÷ (1 − Referral fee %)
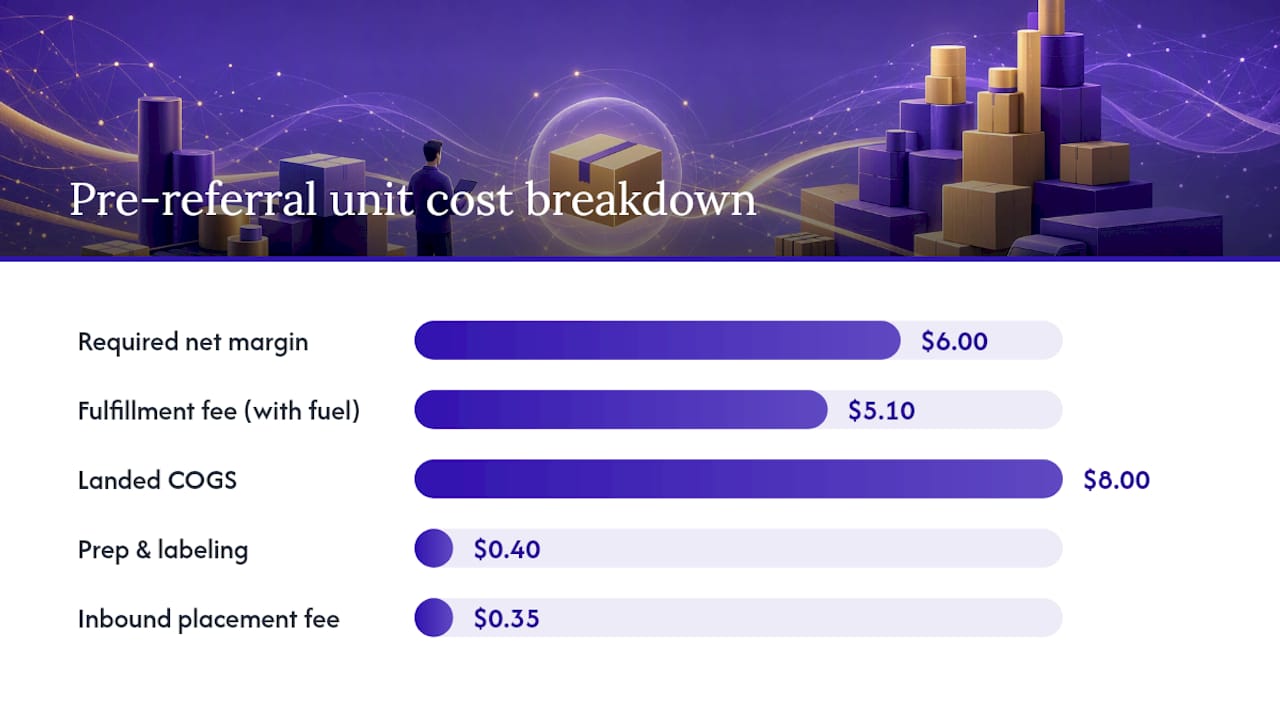
Here’s a worked example. Say you’re reselling a mid-size home goods item with a landed COGS of $8.00, inbound placement of $0.35, prep labor of $0.40, a fulfillment fee (with surcharge applied) of about $5.10, and a required net margin of $6.00 per unit. The category referral fee is typically around a mid-teens percentage, such as 15%.
Gross price = ($6.00 + $5.10 + $0.35 + $0.40 + $8.00) ÷ (1 − 0.15) Gross price = $19.85 ÷ 0.85 Gross price = $23.35
Anything below $23.35 and you’re funding the sale out of your own margin, no matter how attractive the comps look. This is the reverse-floor framework in practice: pick the net-dollar number you need, gross it up for what the platform takes, and only then look outward at the market.
Pro Tip: Rate cards published in blog posts and forums are averages across thousands of SKUs. Pull the actual number for your SKU from Seller Central’s Fee Preview and Selling Economics report before you finalize any floor. A single size-tier misclassification can throw your fulfillment fee off by a dollar or more.
The reason this matters more in 2026 than it did before is simple: fulfillment fees now shift with price bands, so the “average” fee for your category might not apply to your specific price point at all.
Pricing Models That Work for FBA Sellers: Comping, Premium, and Reverse-Floor
Comping and reverse-floor pricing aren’t rivals. They answer different questions. Reverse-floor tells you the lowest price that keeps you profitable. Comping tells you whether the market will actually pay more than that floor, and by how much. The mistake sellers make is treating comps as the starting point instead of the confirmation step.
Use comping as your primary lever when you’re in a high-volume, low-differentiation category, where a dozen sellers list the same item and buyers are mostly price shopping. Use reverse-floor as the dominant model when your COGS varies a lot from batch to batch, like pallet liquidation or thrifted apparel, where one wrong assumption on landed cost can turn a “competitive” price into a loss.
A critical detail here: use sold comps, not active listing prices. Active listings show what sellers hope to get. Sold-listing data shows what buyers actually paid, which is the number that should inform your anchor and target. A listing sitting at $45 for six months with zero sales tells you nothing except that the seller is patient or wrong.
Once you know your floor and you’ve confirmed real sold prices, build a three-point pricing ladder:
- Anchor price — the list price shown to browsing shoppers, usually 10% to 20% above target to leave room for perceived discounts and coupon math.
- Target price — the price you expect most sales to actually transact at, set against the median of sold comps.
- Floor price — the number from your reverse-floor formula, below which the repricer should never go without a manual override.
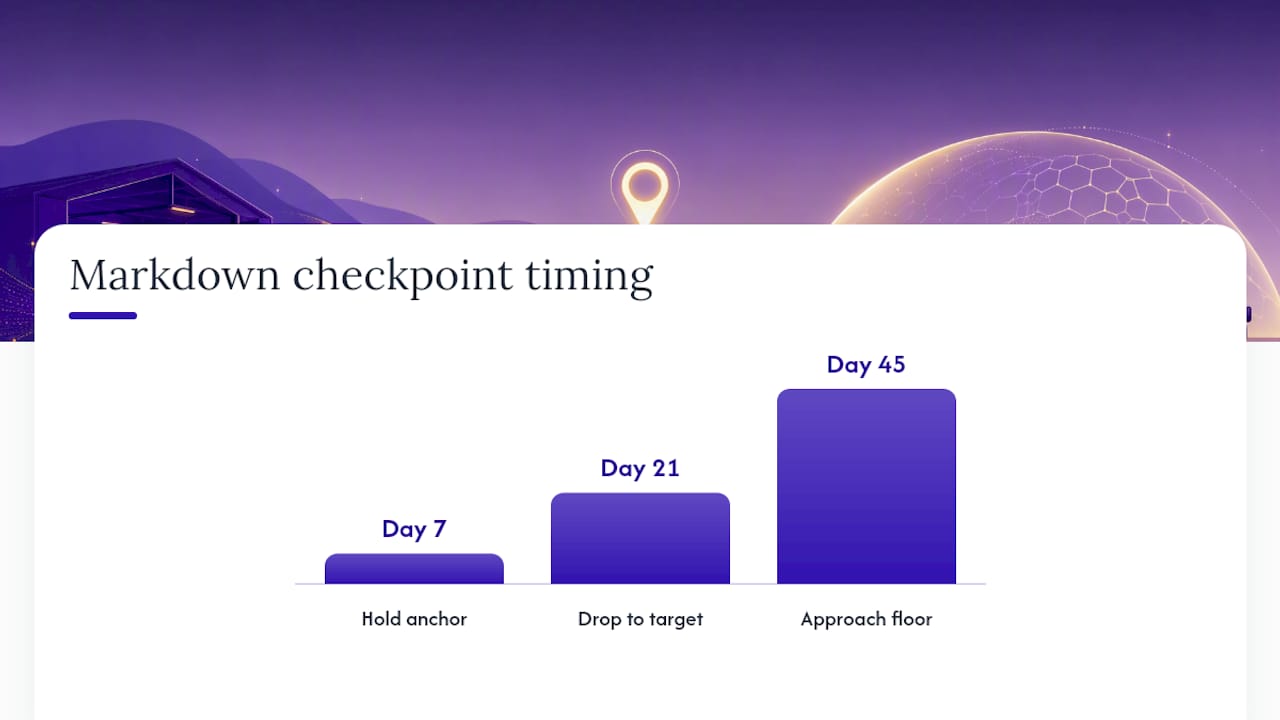
Pair that ladder with fixed markdown checkpoints instead of reactive discounting. A common cadence: hold the anchor through day 7, drop to target by day 21 if velocity hasn’t hit your KPI, and only approach the floor by day 45 if the SKU is still sitting. Fixed checkpoints stop you from panic-discounting after three slow days, which is how margin quietly disappears on otherwise fine inventory.
Premium pricing above the median comp is justified in narrower situations than most sellers assume. It works when you control genuine scarcity (limited supplier runs, a verified-authentic vintage piece), when your listing quality measurably outperforms competitors (better photography, complete size and condition detail, faster ship times), or when you’re bundling complementary items into a single SKU that buyers can’t easily price-match elsewhere. Outside those three conditions, premium pricing mostly just slows your sell-through and pushes you toward the fixed markdown checkpoints sooner than planned. If you’re leaning on listing quality to justify a higher anchor, it’s worth revisiting how the product itself is presented; strong product description technique tends to move the needle more than sellers expect.
Safe Repricing Rules and Automation: How to Keep Repricers From Eating Your Margin
Automated repricers are built on an assumption that quietly breaks near two specific price points: $10 and $50. Most tools calculate fulfillment cost as a static number tied to your SKU’s size and weight tier. But since Amazon’s fee structure now assigns fulfillment fees partly by price band, a static fulfillment-cost assumption is wrong the moment your price crosses one of those boundaries, and the repricer keeps discounting using the old, lower fee number.
The result is a SKU that looks profitable in your repricer’s dashboard while actually losing money on every sale below the boundary. This is one of the more expensive blind spots in automated FBA pricing tactics, because it fails silently. Nothing alerts you. The repricer just keeps “winning the buy box” at a price that no longer covers its own fulfillment fee.
Steps to build band-aware repricing rules:
- Identify boundary SKUs first. Pull every SKU priced between $9 and $11, and every SKU priced between $45 and $55. These are your highest-risk items for band-crossing errors.
- Set SKU-level floor overrides, not category defaults. A blanket “never go below 20% margin” rule doesn’t account for the fee jump at the boundary; it needs a hard dollar floor per SKU.
- Build a repricing rule template per band. One template for sub-$10 items using the lower fulfillment fee, a separate template for $10 to $50 items, and a third for over $50, each with its own floor input.
- Recheck fee assumptions monthly, or immediately after any Amazon fee announcement. Fee bands and surcharge rates aren’t static year to year.
- Export reconciliation reports weekly for boundary SKUs specifically. Compare what the repricer charged against what Fee Preview says the actual fulfillment fee should have been.
Before choosing or configuring a repricing tool, confirm it supports variable fulfillment-cost inputs by band, SKU-level floor locking that a bulk repricing event can’t override, and export reporting detailed enough to reconcile against Amazon’s own fee statements. A tool that only supports a single flat fulfillment-cost field per SKU will misprice every boundary item you carry.
Pro Tip: Keep a standing list of every SKU within $1 of a price band boundary and review it weekly, separate from your regular catalog review. That narrow list is where almost all the silent margin loss happens.
2026 FBA Fee Bands, Fuel Surcharge, and How Small Price Moves Cut Net Margin
Since January 2026, Amazon calculates fulfillment fees partly from three price bands: under $10, $10 to $50, and over $50. Cross from one band into the next and the fulfillment fee itself steps up, independent of any change in your product’s weight or dimensions. Layer the 3.5% fuel and logistics surcharge on top of that fulfillment fee, and a price increase that looks like it should boost your margin can end up mostly funding fees instead.
The math behind the surcharge: model it as a straight multiplier of 1.035 against the fulfillment fee, not the full order value. On a typical mid-tier fulfillment fee, that works out to roughly $0.12 to $0.35 in extra cost per unit compared to the published rate card, depending on the size tier.
Here’s why boundary crossings matter so much more than a same-band price change. Moving your price from $9.00 to $9.50 raises your referral fee by roughly $0.075 (at a 15% rate) and nothing else changes, since you’re still under $10. Moving from $9.50 to $10.50, though, crosses into the next band: the referral fee rises slightly, the base fulfillment fee steps up, and the 3.5% surcharge now applies to that larger fulfillment fee. All three levers move together on a boundary crossing, which is exactly the scenario boundary-adjacent SKUs get wrong when repricers use static assumptions.
| Price move | Referral fee change | Fulfillment fee change | Surcharge impact | Net effect |
|---|---|---|---|---|
| $9.00 → $9.50 (same band) | Small increase | None | None (same fee base) | Mostly flows to margin |
| $9.50 → $10.50 (crosses band) | Small increase | Steps up to next tier | Applies to larger fee | Partially or fully offset by fees |
| $48.00 → $52.00 (crosses band) | Moderate increase | Steps up to next tier | Applies to larger fee | Can reduce net margin despite higher price |
The practical takeaway is that a “safe” price increase inside a band behaves very differently from one that tips a SKU across a boundary. If your target price is near the price band boundaries around $10 or $50, it is worth flagging for manual review before any automated increase runs.
Mitigations worth building into your pricing workflow:
- Bundle to shift price bands deliberately. Combining two low-margin units into one bundle SKU can push the price comfortably past a boundary in a way that benefits you, rather than crossing it accidentally on a single-unit price bump.
- Use Ship in Product Packaging (SIPP) for bulky, low-value items where fulfillment fees are already a large share of the price, since reducing packaging overhead here has an outsized effect.
- Pull Fee Preview before every meaningful price change, not just at initial listing. The Fee Preview tool reflects your actual current fee structure, not a projection based on last quarter’s rates.
- Treat band-aware bundling as a pricing lever, not just a merchandising tactic. The right bundle size can be the difference between funding a fee step and avoiding it entirely.
Launch Pricing and Promotional Cadence: A Week-by-Week Playbook
New listings need a different pricing posture than established SKUs, because the goal for the first several weeks is proof, not profit maximization. A workable six-week cadence looks like this:
- Week 1 to 2: Price at 15% to 20% below your calculated target, not below your floor. The goal is early reviews and initial velocity data, not margin. Watch net margin per unit daily to confirm you’re still above floor even at the discount.
- Week 3: Narrow the discount to 8% to 10% below target if sell-through is tracking toward your unit velocity goal. If it isn’t, hold the deeper discount one more week rather than guessing at a fix.
- Week 4: Move to full target price and introduce a Lightning Deal or coupon layered on top instead of a baseline price cut, so your listed price starts reflecting true target economics.
- Week 5 to 6: Return to organic PPC support only, tapering paid promotion as organic rank stabilizes from the review base you built in weeks 1 through 3.
Track three numbers weekly through this whole window: net margin per unit (never let it dip below your floor even during the deepest discount), ACOS (advertising cost as a share of revenue), and sell-through rate against your inventory plan. If ACOS is climbing faster than sell-through improves, that’s a signal to pull back on ad spend before touching price again.
Coupons and Lightning Deals work best once you’re at or near target price, where the discount feels meaningful to a buyer without requiring you to drop your actual listed price. Reserve PPC-only support for the tail end of the cadence, when you’re trying to sustain rank rather than force velocity. And build a rollback rule into the plan from day one: if net margin per unit drops below floor for more than two consecutive days at any point in the schedule, revert to target price immediately rather than waiting for the next scheduled checkpoint.
Pricing Across the Lifecycle: Markdowns, Clearance, and Aged Inventory
Inventory that sits too long doesn’t just tie up capital, it actively costs you through Amazon’s aged-inventory and low-inventory fee structure, which in 2026 was restructured to assess fees at the FNSKU level with earlier aged-inventory tiers than in prior years. That earlier trigger point means the “just wait it out” instinct is more expensive now than it used to be.
Set numeric thresholds rather than gut-checking each SKU individually:
- 0 to 45 days in stock: hold at target price, no action needed unless a boundary crossing risk applies.
- 46 to 90 days: move to your first markdown checkpoint, reassess sold-comp velocity, and confirm the SKU is still above floor.
- 91 to 180 days: this is where aged-inventory surcharges typically begin applying meaningfully; run the holding-cost calculation below before deciding to markdown further or liquidate.
- 180+ days: default to liquidate or bundle unless there’s a specific, dated reason (seasonal demand returning within 30 days, for example) to keep holding.
The holding-cost calculation is straightforward: implicit cost of holding = opportunity cost of tied-up capital + per-unit aged-inventory fee for that tier. If that combined number exceeds the gap between your current price and your floor, holding is actively losing you money compared to marking down now. Run this monthly for any SKU past the 90-day mark, not just at the point you notice a problem.
Pro Tip: Seasonal SKUs need a separate rule from evergreen ones. A holiday item sitting at day 100 in July is a different decision than a basic accessory sitting at day 100 in any month, since the seasonal item has a demand cliff coming that the formula alone won’t capture. Flag seasonal SKUs for manual review before they hit an automated liquidation trigger.
Operating These Pricing Rules at Scale
The single biggest failure mode I see in FBA pricing isn’t a bad formula. It’s sellers who build the floor-first math once, then never revisit it as fees and inventory age. Segment your catalog into three review cadences: boundary-adjacent SKUs get checked weekly, since that’s where band-crossing fee errors hide. High-velocity, high-value SKUs also get a weekly glance, because a small mispriced margin compounds fast at volume. Everything else can go on a monthly sampling review.
The practical challenge is that most sellers manage this in spreadsheets that go stale within a week. A workflow that pulls live per-SKU fee data and flags boundary SKUs automatically, the kind of thing Resell Ready’s ASIN-level insights are built around, turns a weekly manual audit into a five-minute spot-check. The math doesn’t change. The discipline to run it consistently, at scale, across a few hundred SKUs, is where most pricing strategies quietly fall apart.
— Christian
Put This Pricing Playbook on Autopilot
Running the reverse-floor formula by hand on twenty SKUs is manageable. Running it correctly on two hundred, while tracking which ones are drifting toward a $10 or $50 boundary, is where spreadsheets start missing things. A live dashboard built for exactly this workflow lets you paste an ASIN and get instant net-profit and ROI tracking against your actual landed cost, not a rate-card guess.

An automated inventory dashboard can track capital tied up per SKU, which pairs directly with the holding-cost thresholds covered above, and a verified supplier database helps you nail down the landed COGS number your floor formula depends on in the first place. If you’re sourcing pallets or bulk lots and need to know your floor before you even bid, run the numbers through the Pallet Liquidation ROI Estimator before your next buy. Apparel resellers working the ladder and markdown checkpoints described earlier can plug their SKUs into the Vintage Clothing Margin Calculator to see floor and target side by side in one view.
Primary Sources for the Fee Math
- Fee Preview and Selling Economics: pulls real per-SKU fulfillment fees.
- Amazon’s pricing strategy guidance: the official framework for competitive pricing.
- 2026 fee band and surcharge breakdown: the surcharge math used throughout this guide.
Sources
- FBA Tactics — Price-tier repricing trap
- Pricing for Profit, Not Pricing for Comps — Reseller CFO
- Beancount — Amazon’s 2026 FBA fee overhaul
Recommended
Ready to flip smarter?
ResellReady shows real sold prices, surfaces profitable deals, and builds your buying plan — the Basic plan starts with a 3-day free trial.
Get Started →