Resellers: Turn Distributor Price Lists Into a 30/60/90 Margin Plan

Resellers: Turn Distributor Price Lists Into a 30/60/90 Margin Plan
Analyzing a distributor price list means mapping every SKU to real marketplace data, then running it through ROI filters and a price waterfall until what’s left is a short list of items with confirmed margin and a dollar figure on how much profit is currently leaking out. The fastest route is bulk mapping (UPC or SKU to ASIN), enrichment with sales velocity and fee data, a triage filter pass, and a waterfall check on anything that survives. Done manually, that takes days. Done with the right tooling, it takes an afternoon.
TL;DR:
- Mapping and enriching distributor price lists with accurate product identifiers, sales data, and fee schedules are the most time-consuming steps, but automation tools can complete this in hours.
- Running a price waterfall analysis by combining discount, rebate, freight, and payment data reveals hidden margin leaks that often recover millions in lost revenue.
- Applying early ROI, stability, and seller activity filters typically reduces a 1,000 SKU list to 20-50 items worth full evaluation, saving substantial analysis time.
- Establishing regular, monthly governance of pricing and margin metrics prevents gradual margin erosion caused by untracked overrides and rebate drift.
- Automation platforms with bulk mapping, fee updates, and real-time alerts are essential for managing large SKU volumes effectively and maintaining pricing discipline.
Looking for a tool to run the numbers? ResellReady's reseller profit calculator pulls live comps across eBay, Depop, Mercari, and Poshmark and calculates true net profit after fees. Compare plans and pricing — Basic starts with a 3-day free trial.
Table of Contents
- What Is Distributor Price List Analysis?
- How Do You Map and Enrich a Distributor Price List?
- Which Tools Handle Bulk Price List Analysis Best?
- How Do You Build a Price Waterfall to Find Margin Leakage?
- What Filters Cut a Long Price List Down Fast?
- What KPIs Keep Pricing Gains From Disappearing?
- What Do You Do With the Analysis Once It’s Done?
- What Do Real Price List Analyses Actually Look Like?
- Why Pricing Discipline Beats Pricing Talent
- Run This Workflow Without the Manual Grind
- Sources
- FAQ
What Is Distributor Price List Analysis?
Distributor price list analysis is the process of turning a raw supplier spreadsheet into a ranked, defensible list of what to buy, what to renegotiate, and what to walk away from. Most people call this “checking a price list,” but that undersells what’s actually happening. You’re running a cost evaluation for distributors against live market conditions, then layering in a margin diagnostic that most sellers skip entirely because it takes more than a glance at a cell in Excel.
The confusion starts because “price analysis” gets used loosely. A quick ROI check on ten SKUs is not the same discipline as a full pricing structure assessment that traces a list price down through rebates, freight, and payment terms to what actually lands in your pocket. Both matter. They just solve different problems. The first tells you whether a product is worth buying today. The second tells you whether your whole buying relationship is bleeding margin you haven’t noticed.
Here’s the part that surprises most resellers and even some distribution analysts: the analysis itself isn’t the hard part. Getting a clean, mapped, enriched dataset is. A supplier’s CSV rarely arrives ready to use. Inconsistent UPCs, missing case-pack quantities, and stale list prices are the norm, not the exception. Everything downstream, your ROI math, your waterfall, your KPIs, depends on fixing that first.
How Do You Map and Enrich a Distributor Price List?
Every distributor list starts as a mess of SKUs, list prices, and maybe a UPC column that’s only 80% populated. Your job is to turn that into a dataset you can actually filter and rank.
1. Intake and clean the file. Check for duplicate SKUs, missing UPCs, blank cost fields, and inconsistent units (a “case” that means 6 units from one supplier and 12 from another is a common trap). Standardize currency, case pack size, and minimum order quantity before you do anything else.
2. Match SKUs to your product identifiers. Use UPC or EAN lookups to match rows to ASINs where the codes are clean. For rows missing a UPC, fuzzy-match on product title and brand, then flag anything under roughly 85% confidence for manual review rather than trusting an automated match blindly.
3. Enrich each matched row with marketplace data. Pull in:
- Sales velocity or BSR (best seller rank) history, ideally 6 to 12 months rather than a single snapshot, since a one-time price check misses whether a rank is stable or falling
- Buy-box percentage, which tells you how much of the sales you’d actually capture
- Current FBA and referral fees, since fee schedules shift and stale fee data quietly wrecks ROI math
- Historical price range, so you’re not pricing against a temporary spike
4. Calculate per-SKU ROI, break-even price, and pocket margin. Break-even price is your landed cost divided by (1 minus your fee percentage). Pocket margin subtracts every real cost, freight, storage, returns reserve, from your sale price. This is the number that matters, not the headline margin printed on the distributor’s list.
Data hygiene issues show up constantly at this stage: mismatched units of measure, list prices that haven’t been updated since a supplier’s last catalog refresh, and UPCs that map to the wrong parent listing. Catch these before you rank anything, or you’ll be optimizing against numbers that were wrong from the start.
Which Tools Handle Bulk Price List Analysis Best?
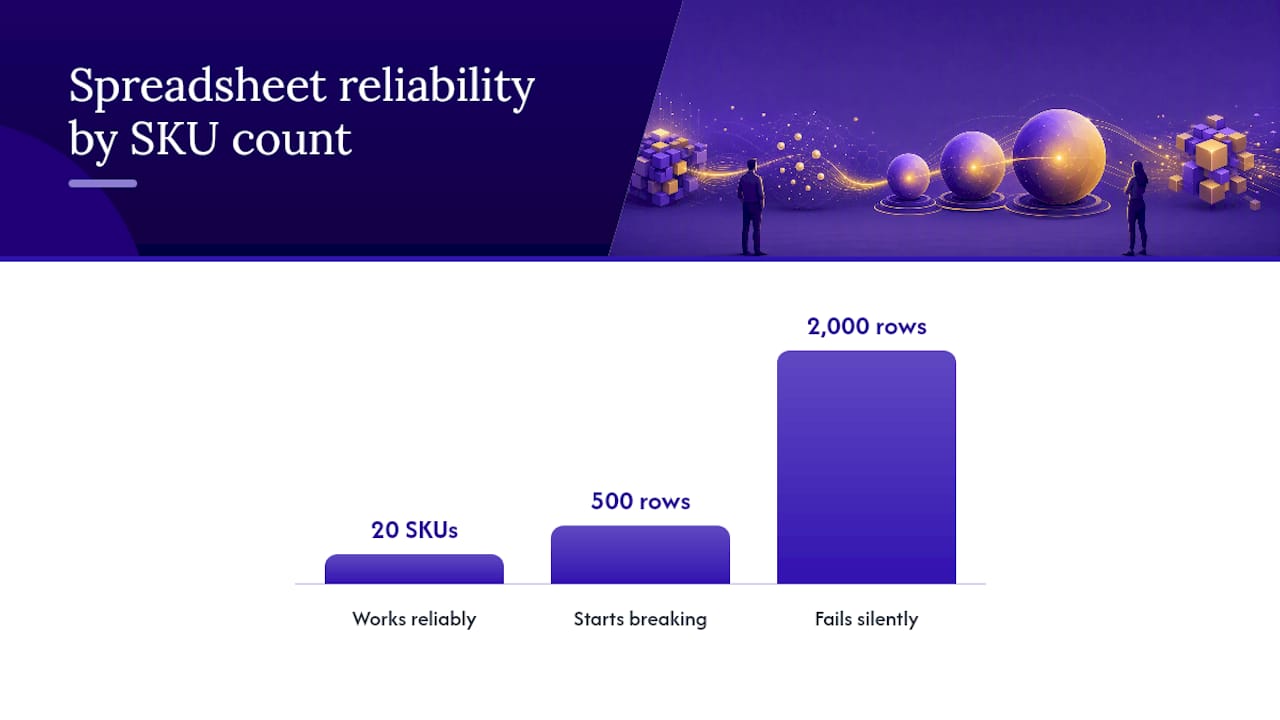
A spreadsheet works fine for 20 SKUs. At 500 or 2,000 rows, it starts breaking in ways that are easy to miss until the damage is done. Manual VLOOKUP chains against ASIN data go stale within days. Fee tables get updated by hand, or they don’t get updated at all. One transposed digit in a UPC column can silently corrupt fifty downstream ROI calculations, and nobody notices until a “profitable” SKU loses money on arrival.
That’s the gap specialist tools are built to close. Look for these capabilities regardless of which one you choose:
- Bulk ASIN or UPC mapping that processes a full CSV in one pass, not row by row
- Automated FBA and referral fee math that updates when Amazon changes its fee schedule
- Built-in ROI, break-even, and margin columns rather than formulas you maintain yourself
- Watchlists that flag price or rank changes on SKUs you’re tracking but haven’t committed to
- CSV export so results can move into your own reporting or ERP system
Purpose-built terminals compress what used to take hours of manual matching into minutes, since the ASIN lookup, fee calculation, and margin math all run automatically instead of being rebuilt by hand for every new list. Resell Ready was built around exactly this problem: paste in ASINs or upload a supplier CSV and get instant buy/skip verdicts with suggested pricing, ROI, and net profit already calculated, backed by a verified supplier directory so the sourcing side isn’t a separate research project. For a reseller evaluating a 1,000 line item wholesale list, that’s the difference between an afternoon of work and a week of it. You can see this play out directly when finding underpriced flips from a supplier CSV, where the bulk mapping step is what makes the rest of the workflow viable at all.
Pro Tip: Run your ROI filter before your fuzzy-match cleanup, not after. It’s faster to manually verify 40 promising matches than to clean 2,000 rows you’ll mostly discard anyway.
How Do You Build a Price Waterfall to Find Margin Leakage?
A price waterfall traces every dollar from list price down to what you actually keep, and it’s the single most underused tool in distributor pricing. Distribution Strategy Group has found that more than half of mid-market distributors lack full visibility into their own waterfall, which means they’re negotiating and pricing against numbers that don’t reflect reality.
The waterfall needs these rows, in order: list price, invoice price (after standard discount), off-invoice allowances, freight terms, payment-term discounts, rebates and volume incentives, and finally pocket margin, what’s actually left. Pulling these inputs means going beyond the price list itself into your ERP for rebate accrual data, your logistics contracts for actual freight terms, and your finance system for realized payment-term discounts rather than the terms printed on the invoice.
Once it’s built, a few patterns tend to show up immediately:
- Discount clusters tied to specific sales reps, often a sign of inconsistent approval discipline rather than legitimate customer-specific pricing
- Rebates applied against the wrong product tier or volume threshold
- Freight terms that were negotiated once and never revisited as volume changed
- Payment-term discounts taken by customers who don’t actually qualify for them
A mid-market distributor that ran exactly this exercise, decomposing transactions and rebuilding its discount waterfall, recovered $1.7 million in lost price realization over twelve months, largely by catching leaks that had been invisible in aggregate reporting.
Quantify each leak in dollars, not percentages, and rank them by size. That ranked list becomes your negotiation and remediation priority, not a vague sense that “margins feel thin this quarter.”
What Filters Cut a Long Price List Down Fast?
A 1,000 row supplier list doesn’t deserve equal attention on every line. First-pass filters exist to get you from hundreds of SKUs to a shortlist worth real analysis, and practitioner data backs this up: applying stability and ROI filters upfront typically eliminates 60 to 90% of a supplier list before you invest deeper time.
- Set a minimum ROI threshold after fees, commonly 20 to 30% depending on your capital cost and risk tolerance, and cut anything below it immediately.
- Check BSR stability over 6 to 12 months, not a single snapshot. A rank that’s declining steadily is a different opportunity than one holding flat.
- Count active sellers and buy-box turnover. More than a handful of active sellers on a listing usually signals a race to the bottom on price.
- Flag hazmat, oversize, and restricted categories separately, since these carry fee structures and approval requirements that change the math entirely.
- Rank survivors by revenue at risk or pocket-margin delta rather than raw ROI percentage alone, since a 25% margin on a high-velocity item often beats a 40% margin on something that sells twice a year.
Run this sequence on a 1,500 SKU file and you typically land on a workable shortlist of 20 to 50 items worth full ROI and sourcing review, a fraction of the original volume.
What KPIs Keep Pricing Gains From Disappearing?
Analysis without governance decays fast. Reps quietly override prices, rebates drift, and six months later margin is back where it started. The fix is a small KPI set tracked on a fixed cadence, not a one-time report.
Track price realization (actual pocket margin as a percentage of list), override rate (how often reps or account managers deviate from approved pricing), pocket margin by segment, discount distribution (to catch the rep-level clustering mentioned earlier), and quote cycle time. McKinsey’s research on distributor pricing found that top performers who treat pricing as a managed system see 200 to 500 basis points of margin improvement, a gap that shows up specifically in organizations with someone actually watching these numbers.
That means naming an owner. Stand up a Pricing Council, a small cross-functional group with a senior commercial lead, finance, and sales operations, and give it real authority: approval thresholds, published price floors, and a monthly review cadence rather than an annual one.
A practical rollout:
- Days 1 to 30: Build the waterfall baseline and identify the top 50 to 100 leakage combinations by customer and SKU.
- Days 31 to 60: Assign named owners to each leakage combo, set 60-day resolution deadlines, and publish price floors.
- Days 61 to 90: Pilot compensation adjustments that align rep incentives with pocket margin instead of volume, and lock in the monthly review cadence.
Pro Tip: Shifting your review cycle for top SKUs from annual to monthly can recover a meaningful share of profit that otherwise gets lost between annual pricing resets, since prices drift silently in the months nobody’s watching.
What Do You Do With the Analysis Once It’s Done?
A finished analysis is worthless if it sits in a spreadsheet. Turn the output into decision rules leadership can act on without re-deriving the logic every time.
- High ROI, stable velocity, low seller count: buy and scale the order quantity.
- Positive but thin ROI with rising seller count: hold at current volume and renegotiate cost before increasing exposure.
- Negative or marginal ROI with declining BSR: phase out and reallocate that capital.
- Strong volume but a waterfall leak identified: don’t touch the SKU, fix the pricing terms first, then reassess.
Build a one-page scorecard with your top 10 actions ranked by dollar impact, not just those with the best percentage returns. Leadership responds to dollars, and a $40,000 opportunity at 22% ROI usually deserves a seat above a $2,000 opportunity at 45%.
After acting, watch for confirmation signals: pocket margin trending up on the affected segment, override rate dropping as reps adjust to published floors, and fewer surprise renegotiations at quarter end. If those don’t move within one full review cycle, the fix wasn’t the right one.
What Do Real Price List Analyses Actually Look Like?
The clearest illustration remains the mid-market distributor that decomposed a full year of transactions, rebuilt its discount waterfall from scratch, and put monthly governance in place instead of an annual review. The result was $1.7 million recovered in price realization, money that had been leaking out through misapplied rebates and inconsistent rep-level discounting nobody was tracking in aggregate.
The pattern repeats at smaller scale for individual resellers working supplier CSVs instead of full distribution ledgers. A wholesale list with 800 SKUs, run through UPC mapping, BSR history, and an ROI filter, routinely narrows to a shortlist under 50 items worth sourcing, exactly the kind of first-pass elimination practitioner guides document as standard for FBA-focused analysis.
What both examples share isn’t the tooling, it’s the discipline. Neither treated the analysis as a one-time cleanup. The distributor case explicitly credits ongoing monthly governance, not the initial diagnostic, for keeping the recovered margin from drifting back. The reseller version of that same discipline is simpler: rerun your filters and waterfall check on a fixed schedule rather than only when a new supplier list lands in your inbox. Margin erosion is gradual and easy to miss without a repeatable check.
Why Pricing Discipline Beats Pricing Talent
Most distributors and resellers treat price list analysis as a skill problem: hire someone sharp, give them a spreadsheet, and trust their judgment. That’s backwards. The data consistently shows the winners aren’t the ones with the best analysts, they’re the ones with the most boring, repeatable process. A Pricing Council that meets monthly and enforces a price floor will outperform a brilliant one-off analysis every time, because margin leakage isn’t a single event. It’s a slow drip that resumes the moment nobody’s watching.
The resistance you’ll hit isn’t usually analytical, it’s cultural. Sales reps see price discipline as a threat to their deal-closing flexibility, and finance teams sometimes treat pricing data as too messy to act on. Overcoming both means starting with a small, visible win, one recovered leak, one shortlist that actually converts, before asking anyone to change how they operate. Bad data is a real constraint too, but perfect data is never coming. Build the waterfall with what you have, flag the gaps, and refine it in the next monthly cycle rather than waiting for a clean dataset that won’t arrive.
— Christian
Run This Workflow Without the Manual Grind
Everything covered here, mapping SKUs, pulling marketplace history, calculating ROI, and flagging what’s worth a second look, is the type of workflow that specialist tools can automate for professional resellers and agencies working large supplier CSVs. Instead of rebuilding VLOOKUP chains every time a new price list lands, you paste ASINs or upload the file and get instant buy/skip verdicts with ROI, net profit, and suggested pricing already calculated.
Specialized platforms may offer inventory dashboards that track commercial vehicle listing analytics automatically, watchlists that flag price target hits proactively, and verified supplier directories that centralize sourcing and analysis. These tools are generally aimed at sellers handling larger SKU volumes rather than casual flippers checking individual items. If your buying decisions currently depend on a spreadsheet somebody built two years ago, check current plans and pricing and see what a live shortlist looks like on your own supplier data.
FAQ
What Is a Price Waterfall in Distributor Pricing?
A price waterfall traces every dollar from list price down through discounts, rebates, freight, and payment terms to reveal pocket margin, the amount you actually keep after every real cost is subtracted.
How Long Does Distributor Price List Analysis Take?
With manual spreadsheet work, a 500 to 1,000 SKU list can take several days; specialist tools like Resell Ready that automate ASIN mapping and ROI math can compress that same analysis into an afternoon.
What ROI Threshold Should I Use to Filter a Price List?
Most practitioners set a minimum ROI of 20 to 30% after fees as a first cut, adjusting based on capital cost and how much risk they’re willing to carry on slower-moving inventory.
How Often Should I Rerun Price List Analysis?
Top SKUs deserve a monthly review rather than an annual one, since pricing gaps and margin leakage tend to reappear gradually once governance and monitoring stop.
Do I Need an ERP System to Build a Price Waterfall?
An ERP helps source rebate accrual and freight data accurately, but a waterfall can start with transaction history and invoice records even without full ERP integration, refining as better data becomes available.
Recommended
Ready to flip smarter?
ResellReady shows real sold prices, surfaces profitable deals, and builds your buying plan — the Basic plan starts with a 3-day free trial.
Get Started →